Group Assignment
Table of contents
In the preparation, tutorial, and individual assignment, we have used various tasks to guide you in image classification and object detection, using examples of trash bins and bikes. In this group assignment, you will apply image classification and object detection to a scenario that is extended from the tutorial session, as shown below:
| Design brief. |
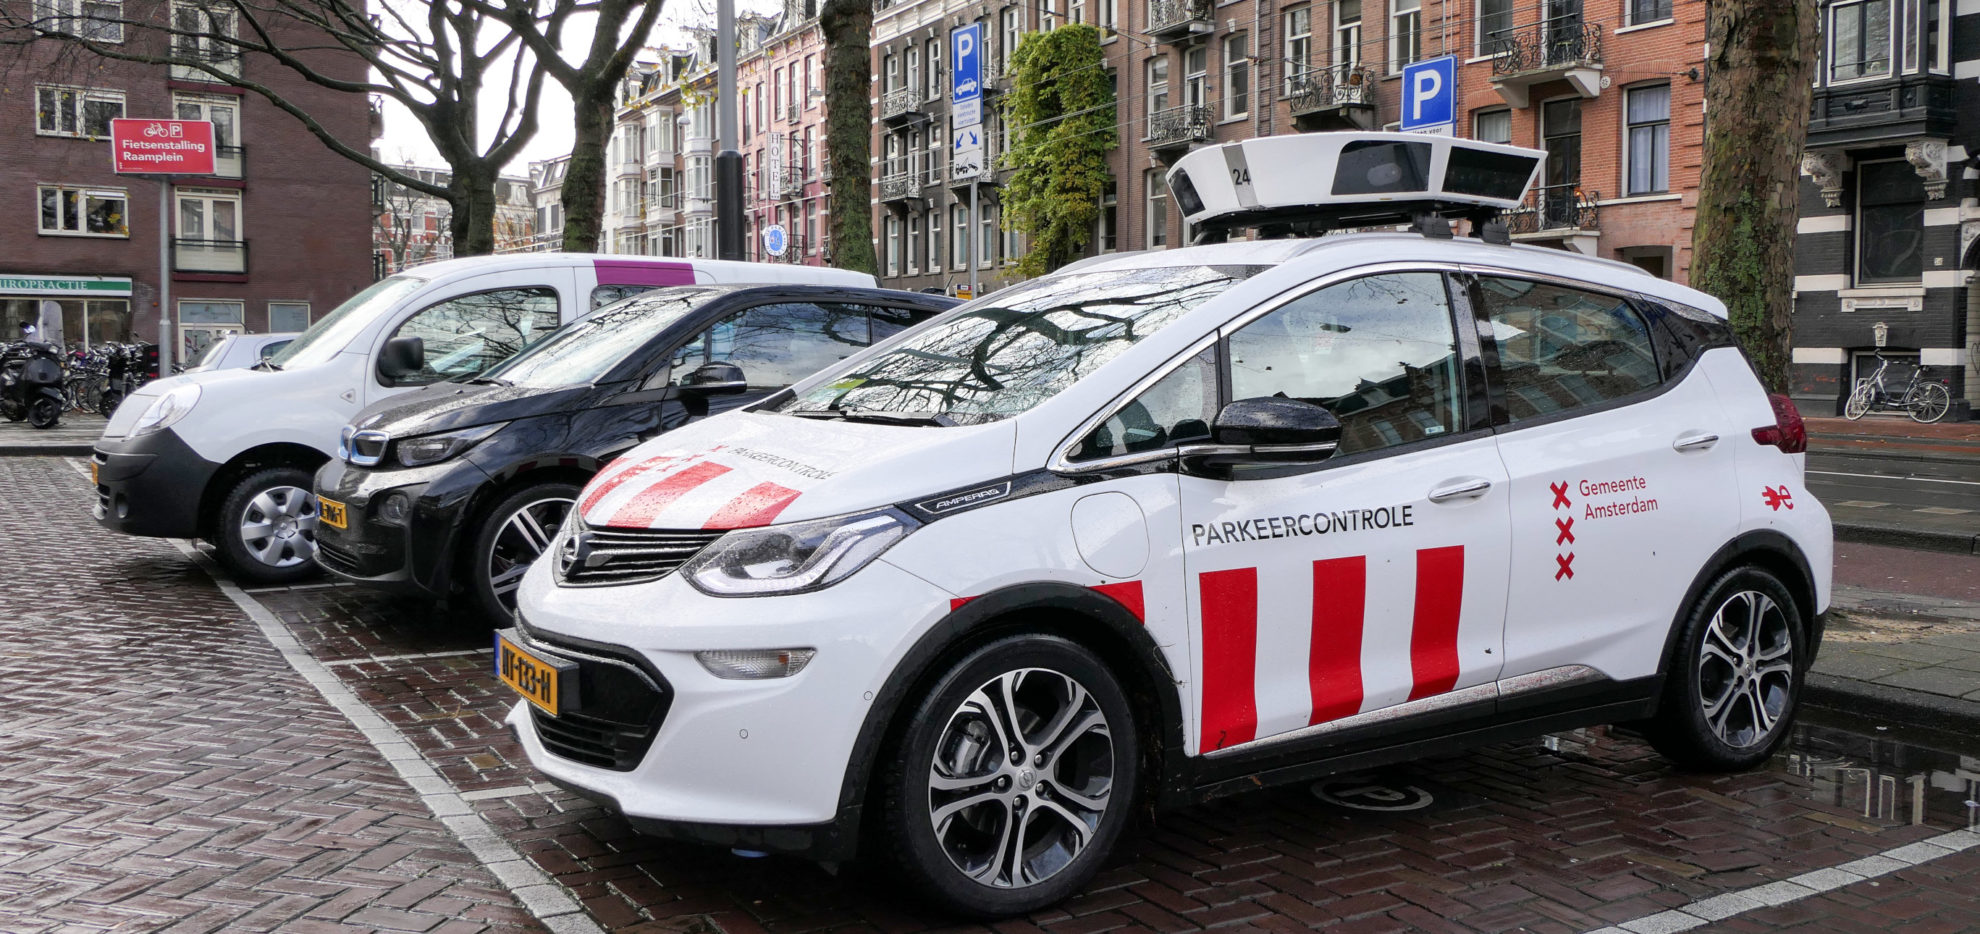
| The Delft municipality hired you and your firm to design a new type of scan car that could help the city understand patterns and usage of public parking spaces. The idea is that the new system can automatically identify different types of vehicles and count the number of vehicles, such as bikes, motorcycles, and cars. The municipality wants to use the new system to study the distribution of vehicles in Delft. |
| However, they do not know if using the existing scan car system that is enriched with standard state-of-the-art image classification and object recognition models would work well. They need your expertise to understand how images (that are taken from the car) perform in different city areas under different environmental conditions (e.g., weather, lighting). Also, they would like you to understand if installing cameras at different places on the car could help achieve different performances. |
 |
| Unfortunately, you have no data from the scan cars since many places in Delft are hard for the scan cars to enter. You are on your own this time to collect your data, and you need to do your best to apply image classification and object detection models to help you analyze the collected photos. |
Tasks
In the group assignment, you need to do the following tasks:
- Collect your own data (as if you were a scan car) in the wild and use image classification and object detection models to process your data.
- For example, take pictures of bikes, motorcycles, or cars in Delft. Make sure that you take pictures in multiple locations. Make sure that you also take pictures that have a good variety, which means that they should have different angles, orientations, scales, and lighting conditions.
- Perform experiments and reflect critically on how images with different conditions (e.g., orientation, scale, occlusion, weather, etc.) affect the output from BOTH the image classification and object detection model. In this way, you can help the municipality to decide which machine learning model to use and how to further improve these models by finetuning them with new data.
- For example, find images that the model fails and think about why. You can use some creativity, such as taking photos in an untypical way or unusual environmental conditions. You can even post-edit the images, such as adding random noise, blurring the image, rotating the image, cropping the image, erasing a part of the image, modifying the color spectrum, etc.
- Experiment with different points of view, using the pictures you take to simulate alternative locations for putting cameras on the scan car. Provide insights about how to collect a good image dataset and what are the good characteristics in the dataset for training machine learning models. In this way, you can inform the design of the camera system on the scan cars.
- For example, think about the situation when the entire dataset only has bike images from the side angle (and without the front or back angles)? Also, what if the entire dataset only has cars that are manufactured in one country, have the same type, or have the same brand? What if all images are taken in the daytime on a sunny day?
And the following is an additional task that you can do to enrich your findings. You will receive extra scores (maximum 1.0 additional score on top of the 10-point scale) for this part if you decide to do this optional task.
- [OPTIONAL] Using the models that you previously used, analyze the density and distribution of bikes, motorcycles, or cars in different places and organize the results to inform the design of the parking service.
- For example, visualizing the distribution of bikes on a map may inform the municipality about where to put bike racks. Quantifying the number of cars in a region may help the municipality decide how large the parking space should be to accommodate the needs.
Deliverable
Your final deliverable is the technical report that will be sent to the municipality to help them improve the design of the new scan car system. Always keep the design brief mentioned above in mind when writing the report. In the report, you need to explain how you completed the above-listed tasks and what the results are. Specifically and importantly, your report MUST have the following sections, where we will assess your learning outcome based on the grading rubric at the end of this handout. Failing to have these sections will significantly and negatively impact your score.
- Summary
- Provide a summary of what you did and your findings. Maximum 150 words.
- Data Collection and Processing
- Explain how you collect the data. For example, where were the locations that you took the photos? When did you take the photos? Show what data you collect. For example, by including images in the report, providing a valid link (that is publicly accessible) to a repository such as GitHub or Google Drive. Show and explain how you process the data. For example, by including code in the report and explaining how the code works in a good detail.
- [OPTIONAL] If you did the optional task, show and explain the analysis result of the density and distribution of bikes, motorcycles, or cars in Delft. For example, by using a well-organized table or a map-based visualization.
- Model Capability Experiments and Reflections
- Describe the procedure of the experiments that you did to understand the capability of the model. For example, what are the images that you used in the experiment? What are the model outputs from these images? What are the aspects (e.g., lighting conditions, orientation and scale of the objects, etc.) that you considered during the experiment?
- Describe your findings from the experiment and reflect on the model’s capability to process images with different conditions. For example, what happened to the images with many bikes crowded together? Is the model working when the photos are blurry?
- Findings to Inform the Product-Service System
- Describe how your findings from the model capability experiment can inform the municipality to improve the camera system on scan cars. For example, how should image data be collected and processed? Where should the camera be placed on the car, and what are the pros and cons of these different locations on the car? What are the limitations of the machine learning models, and what are the images that we should collect to further train and finetune the existing model?
- [OPTIONAL] If you did the optional task, describe how your data analysis result can inform the municipality to design a better parking service. For example, where to put bike racks and how large the bike racks should be.
- Distribution of Group Collaboration
- Describe the distributions of effort in the groups. Make sure that you keep track of this information. It is not acceptable to simply say “all members work together” or “all members contributed equally”. If there are any problems with collaboration, please inform the course coordinator as soon as possible.
In addition, if you read articles (e.g., online blogs, academic papers) and take their ideas, make sure that you cite and attribute the works in your technical report. It is essential to keep this integrity in scientific research.