Tutorial
Table of contents
- Task 5: Reading data
- Task 6: Preprocessing
- Task 7: Word Frequencies
- Task 8: Sentiment Analysis
- Task 9: Topic modeling
This section explains the tasks you will perform during the tutorial session with the guidance of the course coaches. In the tutorial session, we will first discuss your findings regarding the tasks described in the “Preparation” section. Next, we will introduce another scenario, where you will use a different collection of textual data and analyze it using Python.
| The Design brief |
| Delft University of Technology hired you and your firm to suggest ways to improve the bachelor students’ experience during the COVID era. Any kind of suggestion could be acceptable, as long as it reflects how students feel. |
| To start with, one of your collaborators asked TU Delft students to anonymously answer some questions regarding their student experience during corona and the main challenges they encountered. After collecting all the responses, your collaborator handed them to you to check if you could identify any emerging patterns or gain insights regarding the experiences and feelings of the students. |
 |
| Unfortunately, the deadline of this project is approaching, so reading and interpreting manually each students’ input will be too slow. Use your newly acquired text-processing skills towards analyzing all the collected data and based on your findings suggest ways to improve the student’s experience in these difficult times. Please, keep in mind, some of these answers are translated from Dutch to English, so there may be translation artifacts. |
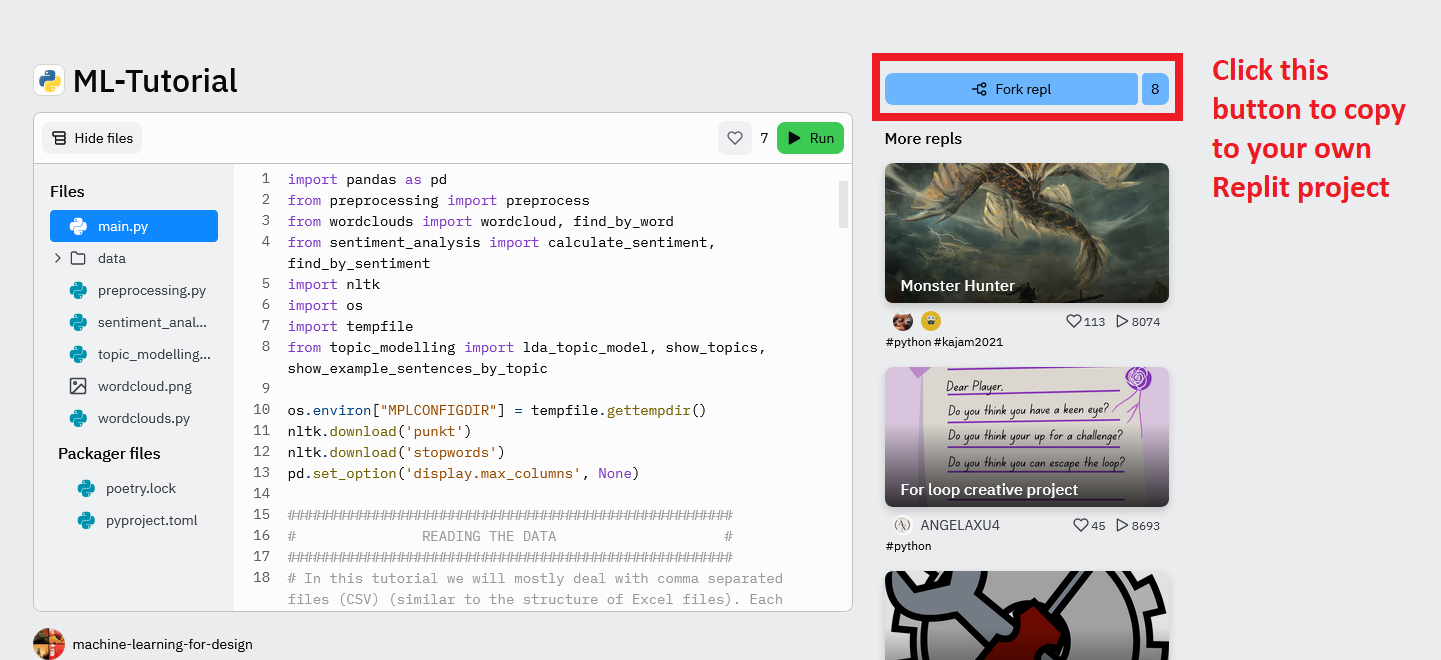
To begin with, check the code on Replit. This repl contains the code and text data that we are going to use in this task. Press the fork button and it will copy the code and data to your own Replit project. The “main.py” file contains the main body of code. This is the only file that you will need to edit during the tutorial, individual assignment, and group assignment. Together we will also explore the other files (e.g. “preprocessing.py” and “topic_modelling.py”) and discuss them. In the following sections of this document, we provide a summary of the tutorial along with some questions that aim to help you understand the usefulness and importance of each task. Press the fork button and it will copy the code and images to your own Replit project.
Task 5: Reading data
In this task we will show you how you can read large Comma-separated values (CSV) files in Python. CSV files are delimited text files that use commas to separate values. Basically, each line of the file is a data record. Each record consists of one or more fields, separated by commas. CSV is one of the most used file formats and it is very often used to store replies to questionnaires or surveys.
In the first part of the “main.py” code, you can see how to read the data using a Python library called Pandas. Within this course, we are not going to delve into the interesting world of Pandas but if you want to learn more, Google is your friend (https://pandas.pydata.org/docs/getting_started/intro_tutorials/).
This line allows you to read the data from the directory:
students_data = pd.read_csv("data/students_eng.csv")
Run the code and you will see something like the following on the right side of your screen:
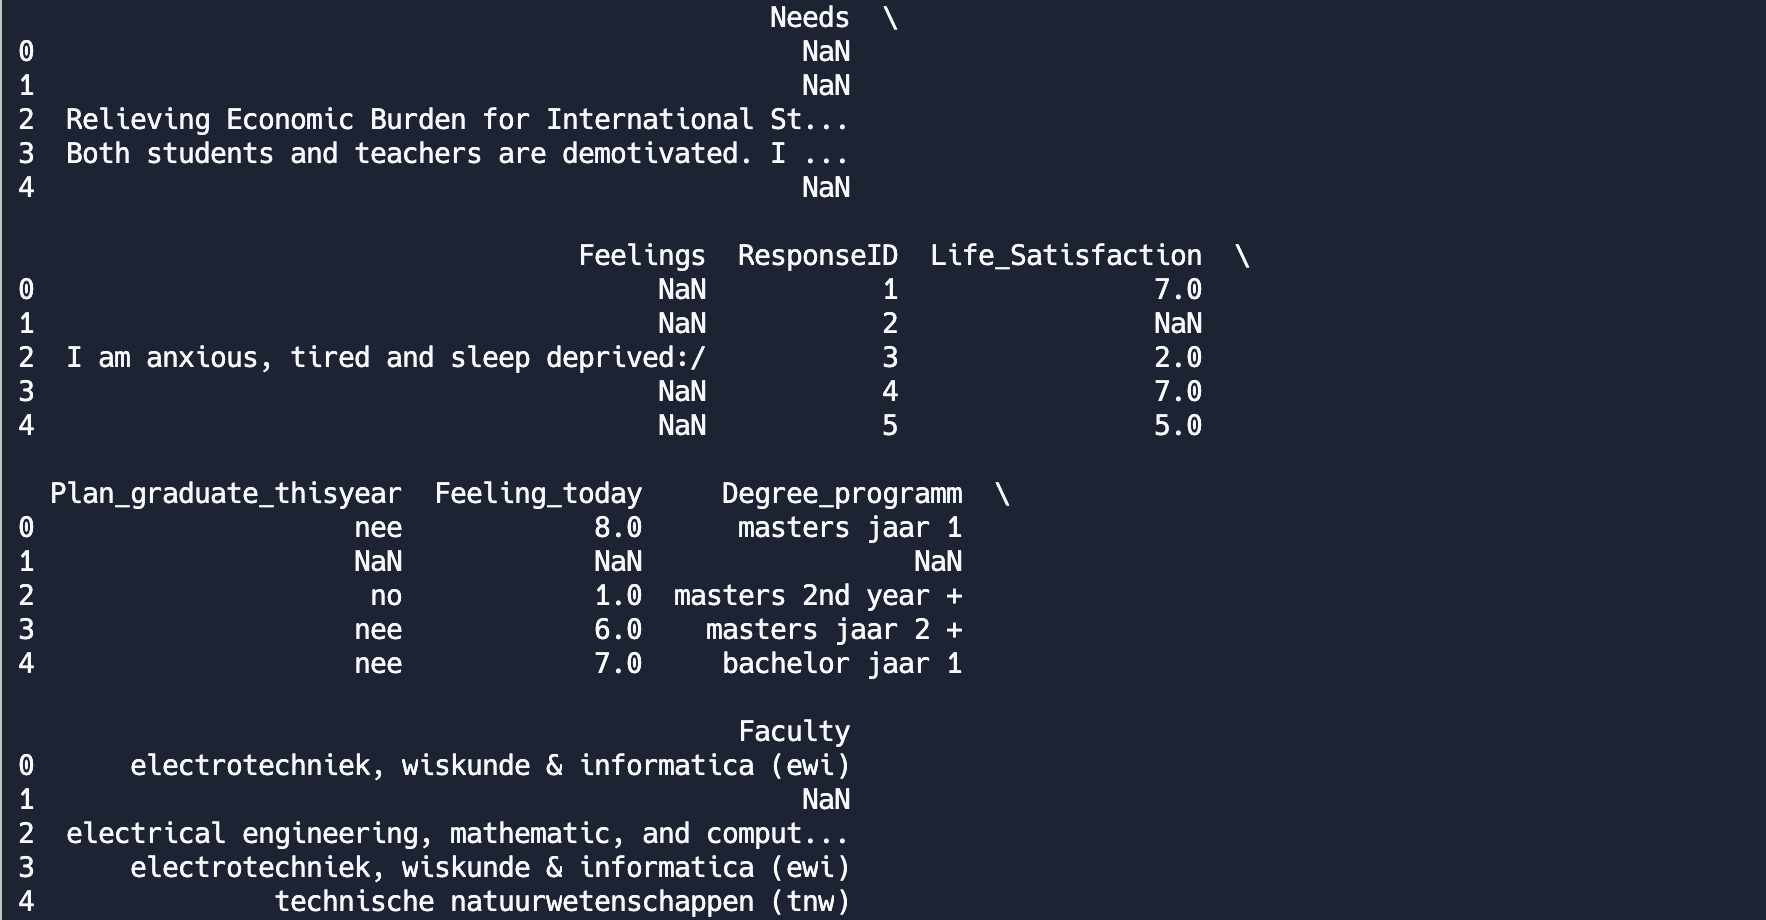
As you can observe, our data has an excel-like format: one line per data record (based on the student who reviewed the course) and columns that contain different types of information (e.g. Needs, Feelings, ResponseID, Life_Satisfaction, etc.):
print(students_data.head(3))
Lastly, since we are mostly interested in what people wrote about their feelings (the “Feelings” column) we create a large list that only contains the students’ comments. This list will include the main text we are going to analyze within this tutorial. To keep only the “Feelings” column you need to uncomment the following line:
students_data = students_data['Feelings'].loc[students_data['Feelings'].notna()]
This line will select the column “Feelings and will apply the filter to remove rows with NaN values (those cells are empty).
Then you will need to merge all the different lines of the “comments” column into one big corpus. Basically, you will transform all the comment-lines into one big list, by uncommenting the following lines:
corpus = students_data.to_list()
If you want to see what this list looks like, you can uncomment the printing line:
print(corpus)
Then, you will see a big list with all the filtered comments (basically the comments of all students separated with a comma)
 Within this task we learned how to read a CSV document, filter out the lines of interest and create a big list that contains all the filtered text.
Task 6: Preprocessing
Are we ready to analyze our text yet? We are close, but not yet. First, we need to preprocess our text. This step is very important. Text is often messy, containing many words that while they are very commonly used carry very little useful information such as “and” or “a”. In this task, we will show you how to preprocess your text so that you can later analyze it. We will focus on: making all words lowercase, word tokenizing all sentences, removing stopwords, punctuations, and digits, and reducing inflected words to their word stem (stemming).
To preprocess and print your text you need to uncomment the following lines:
tokens = [preprocess(sentence, lower=True, rem_punc=True, word_tokenization=True,
    rem_numb=True, rem_stopwords=True, stem=True, extra_stopwords = []) for sentence in
    students_data.to_list()]
print(tokens)
Run the code again and you will see a large piece of text that looks like the following:

Each of the original sentences has been preprocessed and transformed into a list of words. For instance, the [sport, physic, connect] refers to a preprocessed answer of a student.
Feel free to change some of the variables from “True” to “False”. Do you see the difference in your results? Do you understand why preprocessing is important? If you want to dive even deeper into how the preprocessing step works you can look at the “preprocessing.py” file (optional).
Task 7: Word Frequencies
Word frequencies calculation is the most basic tool in text processing yet it gives a comprehensive picture of the content in your text collection. One the most ways to visualize word frequencies is WordCloud (which you’ve already seen if you opened Voyant)
wordcloud(words = tokens, name_of_output = 'wordcloud', num = 10)
This function needs two things from you:
- tokens – the result of our preprocessing step
- the name of the picture it will generate and save to your directory
- a number of words to show
Text processing often requires working with examples, because words are often contextual and it is difficult to understand what is happening in your text collection. For this purpose, you can find documents by pieces of texts.
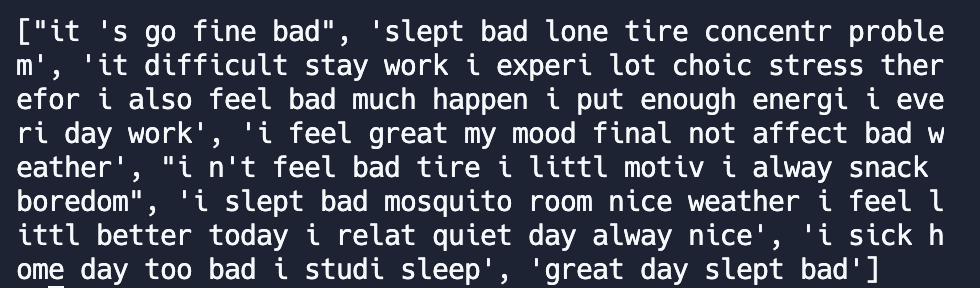
test = find_by_word(tokens, 'bad')
This function needs two things from you:
- tokens – the result of our preprocessing step (it will look for examples in this collection)
- a word or a phrase the text should include
And it will return examples of texts that include this word:
Task 8: Sentiment Analysis
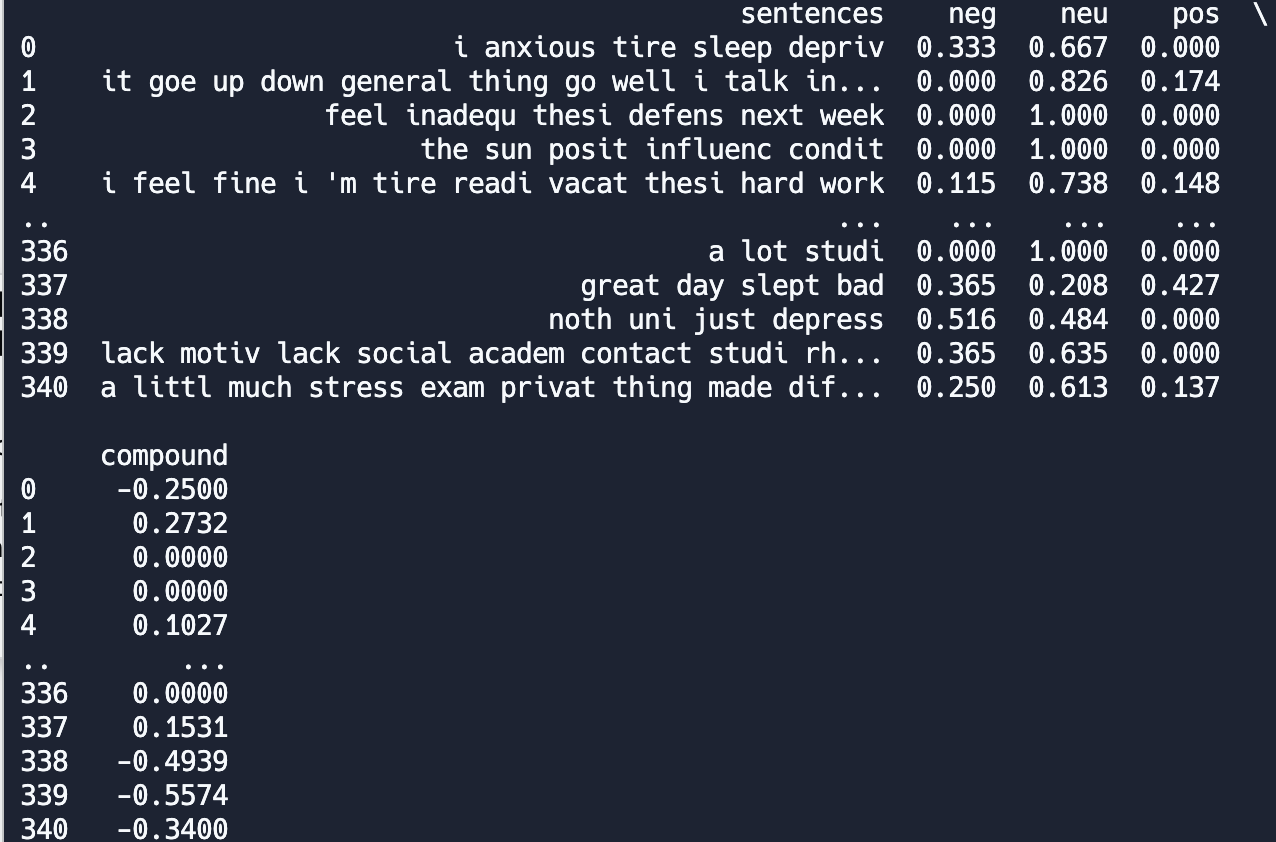
The aim of sentiment analysis is to calculate how emotional your texts are and what is the valence of these texts. In our example we use VADER (Valence Aware Dictionary and sEntiment Reasoner) but you can find other various sentiment analysis tools on the internet. VADER calculated how positive, neutral, and negative a text is. It also calculates a compound score which considers all three metrics to give you a precise measurement of the sentiment.
VADER calculated how positive, neutral, and negative a text is. It also calculates a compound score that considers all three metrics to give you a precise measurement of the sentiment.
This function requires:
- tokens - the preprocessed collection of texts
- min_len - minimal length of the texts to be analyzed
min_len = None
#min_len = 5

sent_result = calculate_sentiment(tokens,min_len=min_len)
print(sent_result)
These lines will return this output:
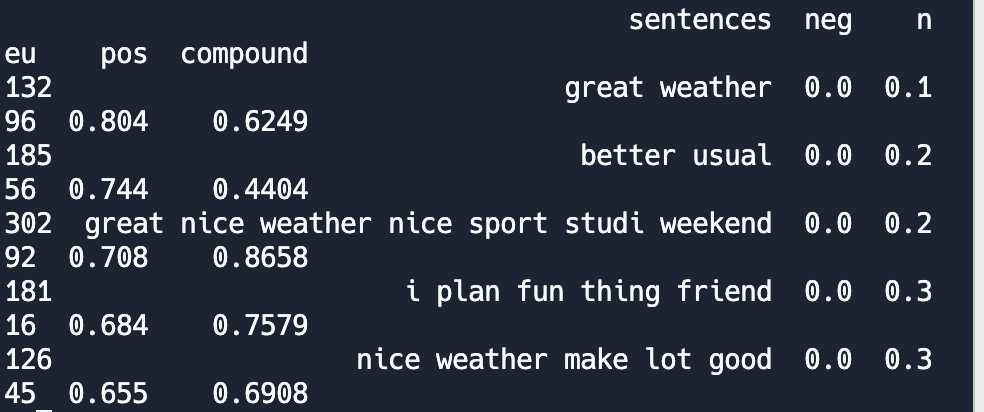
Now, when the sentiment scores are calculated, you can find the most interesting texts by looking at the documents with the highest scores (in this example, we look at the 5 most positive documents).
res = find_by_sentiment(df_with_scores = sent_result, score_type = 'pos', num_of_examples = 5)
print(res)
This function requires three things:
- The result of sentiment calculation
- What score you’re interested in
- A number of examples you want to get
These lines will return this output:
Since sentiment analysis is sensitive to text length, it is important to set a minimum text length to ensure that the analysis is based on texts with enough content to provide meaningful sentiment results. By default, if min_len is not provided, all texts will be considered for sentiment analysis. However, by setting a minimum text length, we can filter out texts that are too short for meaningful sentiment analysis results, and focus on analyzing texts that are more likely to provide useful insights.
Task 9: Topic modeling
What common needs do students talk about? In this last section, we will show you how to identify the discussed topics within an entire selection of texts. For this we will use the latent Dirichlet allocation (LDA) is a generative statistical model that allows sets of observations to be explained by unobserved groups that explain why some parts of the data are similar1. In this final task, we will apply the LDA model to our text and try to identify common topics.
Basically, each document in our data (i.e. each student’s input) is represented as a distribution of topics (e.g. 30% of topic 1, 20% of topic 2, and 50% of topic 3). Each topic is represented as a distribution of words that are more likely to occur together. We call this process clustering.
To build a model, you need to define three things:
- tokens, corpus - sources of your data
- num_of_topics - number of topics to generate.
- min_len - minimal length of texts to consider.
num_of_topics = 30

min_len = None
#min_len = 5
Number of topics will define how detailed the clustering will be. Set a too-small number and your topics will be an indistinguishable mix of everything. Set the too-high number and your topics will duplicate.
Picking the right number is an art and science :smile: but there is a rule of thumb:
For short corpora focused on very specific subject matter (such as survey experiments) 3-10 topics are a useful starting range. For small corpora (a few hundred to a few thousand) 5-50 topics are a good place to start. Medium-sized corpora (10k to 100k documents) – 60-100 topics to work well. For larger corpora, 100 topics is a useful default size2.
Minimal text length will define which documents will be analyzed. Because the proportion of words in the text matters, the length of the text is also important for this task. Too short texts will generate inadequate proportions which will lead to a less accurate model and will make analysis more difficult
To run the model you will use this line:
lda_model = lda_topic_model(tokens, topic_num=num_of_topics)
show_topics(lda_model, word_num_per_topic )
This function will save the model in your folder:
To load an existing topic model you will use next line:
lda_model = LdaMulticore.load("lda_model")
Be careful when working with topic models. Every time you will run the function “lda_topic_model” it will create a new model which can make the interpretation process difficult. That’s why in your code you can save the model in a separate file and load it from there.
You, as researchers, have to interpret the topics to make the most use of them. To do so, you can define two variables:
- word_num_per_topic – the number of most probable words for each topic to show
- num_of_examples – the number of the most probable texts for each topic to show
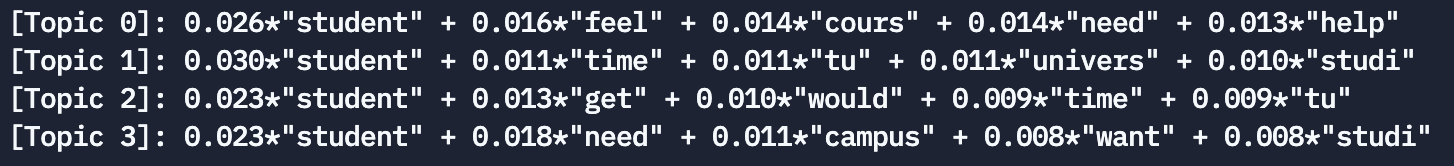
To work with outputs of topic models you have a couple of functions. To check the most likely words of the topic you can run these lines:
word_num_per_topic = 7
show_topics(lda_model, word_num_per_topic )
Run the code and you see the different topics described by the respective words. Each word is assigned a number that reflects the probability of this word being representative of this topic.
Changing word_num_per_topic will not affect the model itself – only the output of the model you want to see.
As mentioned above, each document in the text collection is represented as a distribution of the identified topics. It means that topics better represent some texts than others. When text is the most probable for the topic, it means this text most likely reflects the topic. To interpret the topics, you can generate examples of the most probable texts for each topic.
This line will generate a CSV file “examples_of_topics.csv” which will store N text documents for each topic. In this case, 5 text documents for each topic.
num_of_examples = 5  #will show 10 most probable examples for each topic

show_examples_for_all_topics(corpus,lda_model,tokens, word_num_per_topic=word_num_per_topic,num_of_examp_to_show=num_of_examples,min_len=min_len)
You can also check the examples for one particular topic:
num_of_examples = 5  #will show 5 most probable examples for each topic
topic_id = 1

show_example_sentences_by_topic(corpus,tokens,lda_model,word_num_per_topic, topic_to_check=topic_id, num_of_examp_to_show=num_of_examples,min_len=min_len)
this line will show you N text documents for one particular topic set in topic_id variable. Run the code and you will see a number of examples and the main topic that was assigned to them, like the following:
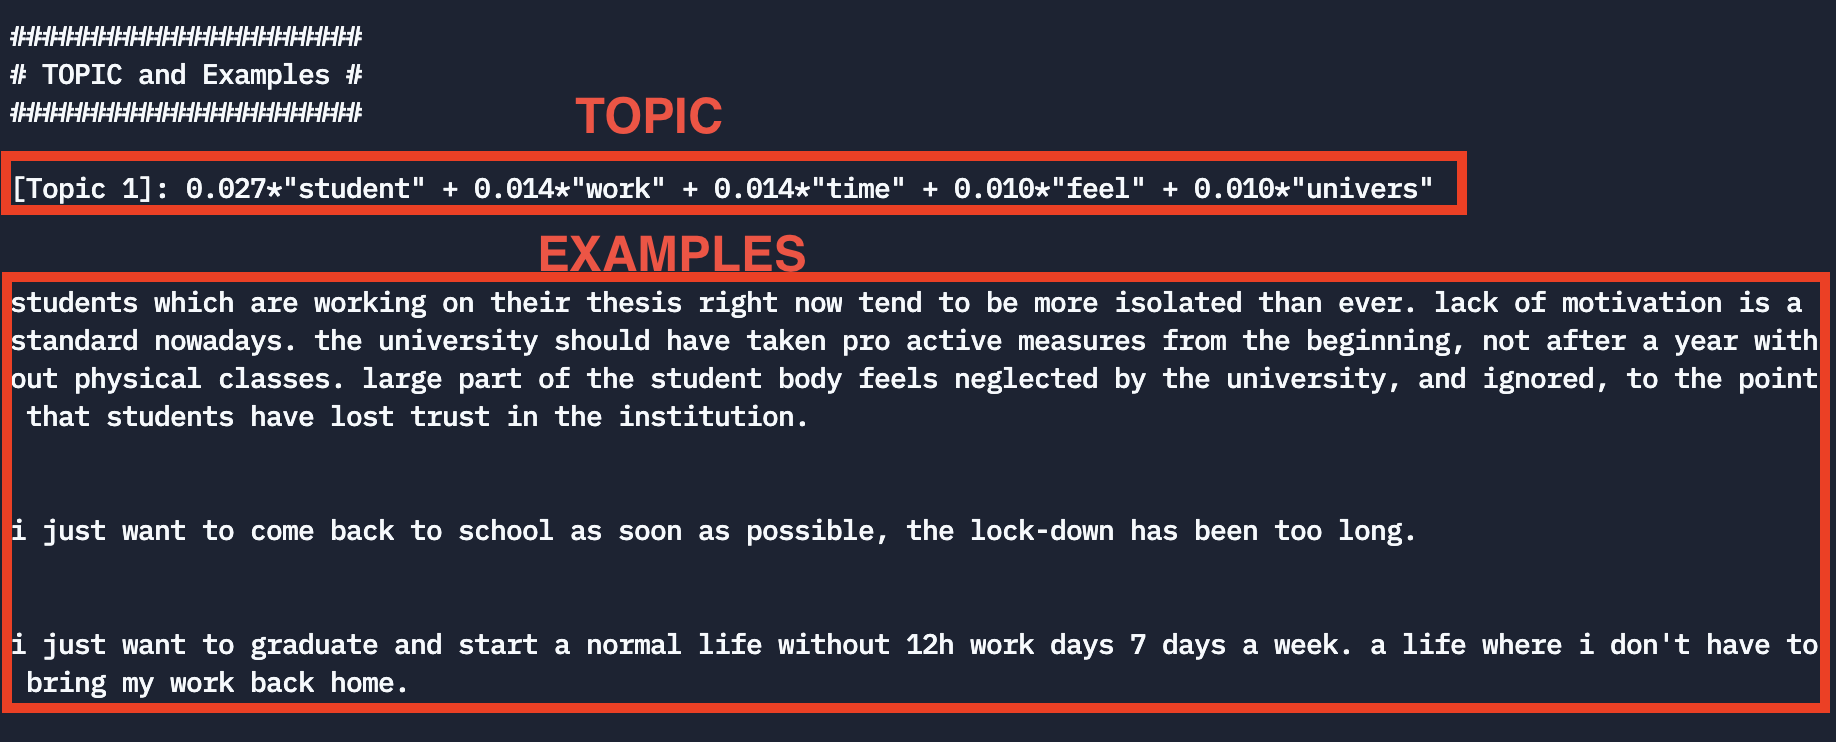 Think if the topic is well assigned to the students’ input. Try to run again the LDA model using a different number of num_of_topics and the word_num_per_topic and reflect on the results and the influence of these two variables on them.
1https://en.wikipedia.org/wiki/Latent_Dirichlet_allocation
2https://cran.r-project.org/web/packages/stm/stm.pdf